How to monitor Linux network quality for different directions
Date December 7th, 2016 Author Vitaly Agapov
Sometimes we might need to know if the network connection between our host and other peers is good enough. The main quality attributes of the network connection are badwidth (quite easy to explore) and the packet loss rate (quite difficult to explore). Of course we can monitor the overall TCP retransmit rate (for example using something like netstat -s | grep -i retrans), build the graph and stare at it. But we'll never know which direction is loosing the packets and where is the problem itself.
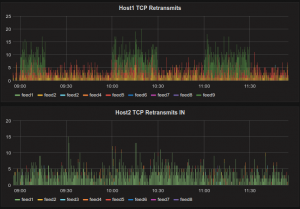
I have not found the ready-to-use solution and created my own. You can see the results right here on the screenshot.
While looking for some options I have found the Brendan Gregg's perf-tools project. I studied it, then I studied ftrace Linux tracer and tcp stack in Linux kernel sources. And after that I created the first tool intended to solve the TCP retransmit monitoring problem. It is called tcptracer and available on GitHub. It makes use of Linux ftrace tracer, subscribes for tcp_retransmit_skb() and tcp_send_loss_probe() system calls and writes all the events to file and/or Elasticsearch.
This tool is good enough and doesn't create any resource usage overhead. But it has one major lack of functionality – it shows only the outgoing TCP retransmits. There is no traceable kernel function that could be used to catch the incoming retransmits or something related (like sending SACKs). So tcptracer can be useful for traffic producers, not traffic consumers.
So then I created one more tool which solves the problem much more straightforwardly but with greater resource usage overhead. It is called pcapgazer and is available on GitHub too. The main idea is to capture the PCAP dump from the network interface and then parse the files looking for retransmits, out-of-order segments or other anomalies. It still can write the data to text files and/or Elasticsearch so we can create pretty-looking charts showing the situation on all the directions.
The best way of using pcapgazer is to run it as a post-rotate command in tcpdump:
tcpdump -nnpi eno1 -s 64 -W 50 -C 10 -w /var/dumps/dump tcp and port 443 -z /opt/pcapgazer/pcapgazer.pl
This could be a good idea to set the non-zero -s argument (64 for example) to save only the segment header and drop the payload if you sniff the traffic only for pcapgazer and you are not intending to use it for some other purposes.
Tags: Linux, Perl
Category:
Linux, Perl |
No comments »
