Записи с тэгом ‘Kubernetes’
Nagios style plugin for Kubernetes monitoring
Wednesday, July 4th, 2018
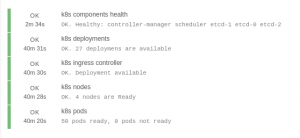
Usually when one thinks about the active monitoring of Kubernetes health then the Prometheus + Alertmanager comes to his mind. This is quite obvious way especially when Prometheus is already an almost mandatory component of the Kubernetes cluster. But what if I am happy with my Icinga/Zabbix/"even Nagios" setup which is monitoring my beyond-Kubernetes stuff and I want to keep everything in one place, manage the contacts, notifications as I used to? Then I need a plugin. And I have one. It is right here:
https://github.com/agapoff/check_kubernetes
The repo has a detailed README so I won't repeat it here. Just use it, feedback and contribute.
Метки: Kubernetes, Nagios
Категория: Kubernetes | Нет комментариев »
Yet another Fluentd deployment for Kubernetes
Wednesday, June 27th, 2018
 It is always mandatory to make logs from the services available for developers and other involved persons. And this access is expected to be not too complicated, without kubectl magic and dashboards (when we are talking about Kubernetes). It is quite easy to start exporting all logs from the Kubernetes cluster to Elasticsearch. The most straightforward way is:
Метки: Docker, Elasticsearch, Fluentd, Kubernetes
Категория: Kubernetes | Нет комментариев »
Yet another Prometheus deployment for Kubernetes
Friday, June 22nd, 2018
— You don't have a right thing, friend. You've got a whole plateful of maybe a little less wrong.
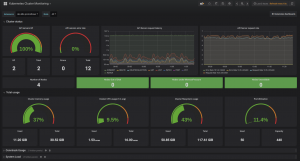
I have kept silence here for some time. But at last I have something short to say. Recently I was trying to prepare gathering of metrics from bare-metal Kubernetes clusters for observing them from my favourite Grafana. And it appeared that it's quite difficult to do that using the official documentation and blog posts. Moreover the presented Grafana dashboards were not good enough for me. So when I finished my investigations and experiments and when I was finally happy with my dashboard visualizations I pushed them to Github. The repository can be found here: https://github.com/agapoff/kubernetes-prometheus. It contains the K8s manifests for deploying Prometheus with node-exporter and kube-state-metrics apps and the appropriate ConfigMap. It also contains the json files for Grafana dashboards which can be imported and used out of the box (you need only to create the Prometheus datasource).
Feel free to feedback and contribute.
Метки: Docker, Grafana, Kubernetes, Prometheus
Категория: Kubernetes | Нет комментариев »

