Yet another Prometheus deployment for Kubernetes
Date June 22nd, 2018 Author Vitaly Agapov
— You don't have a right thing, friend. You've got a whole plateful of maybe a little less wrong.
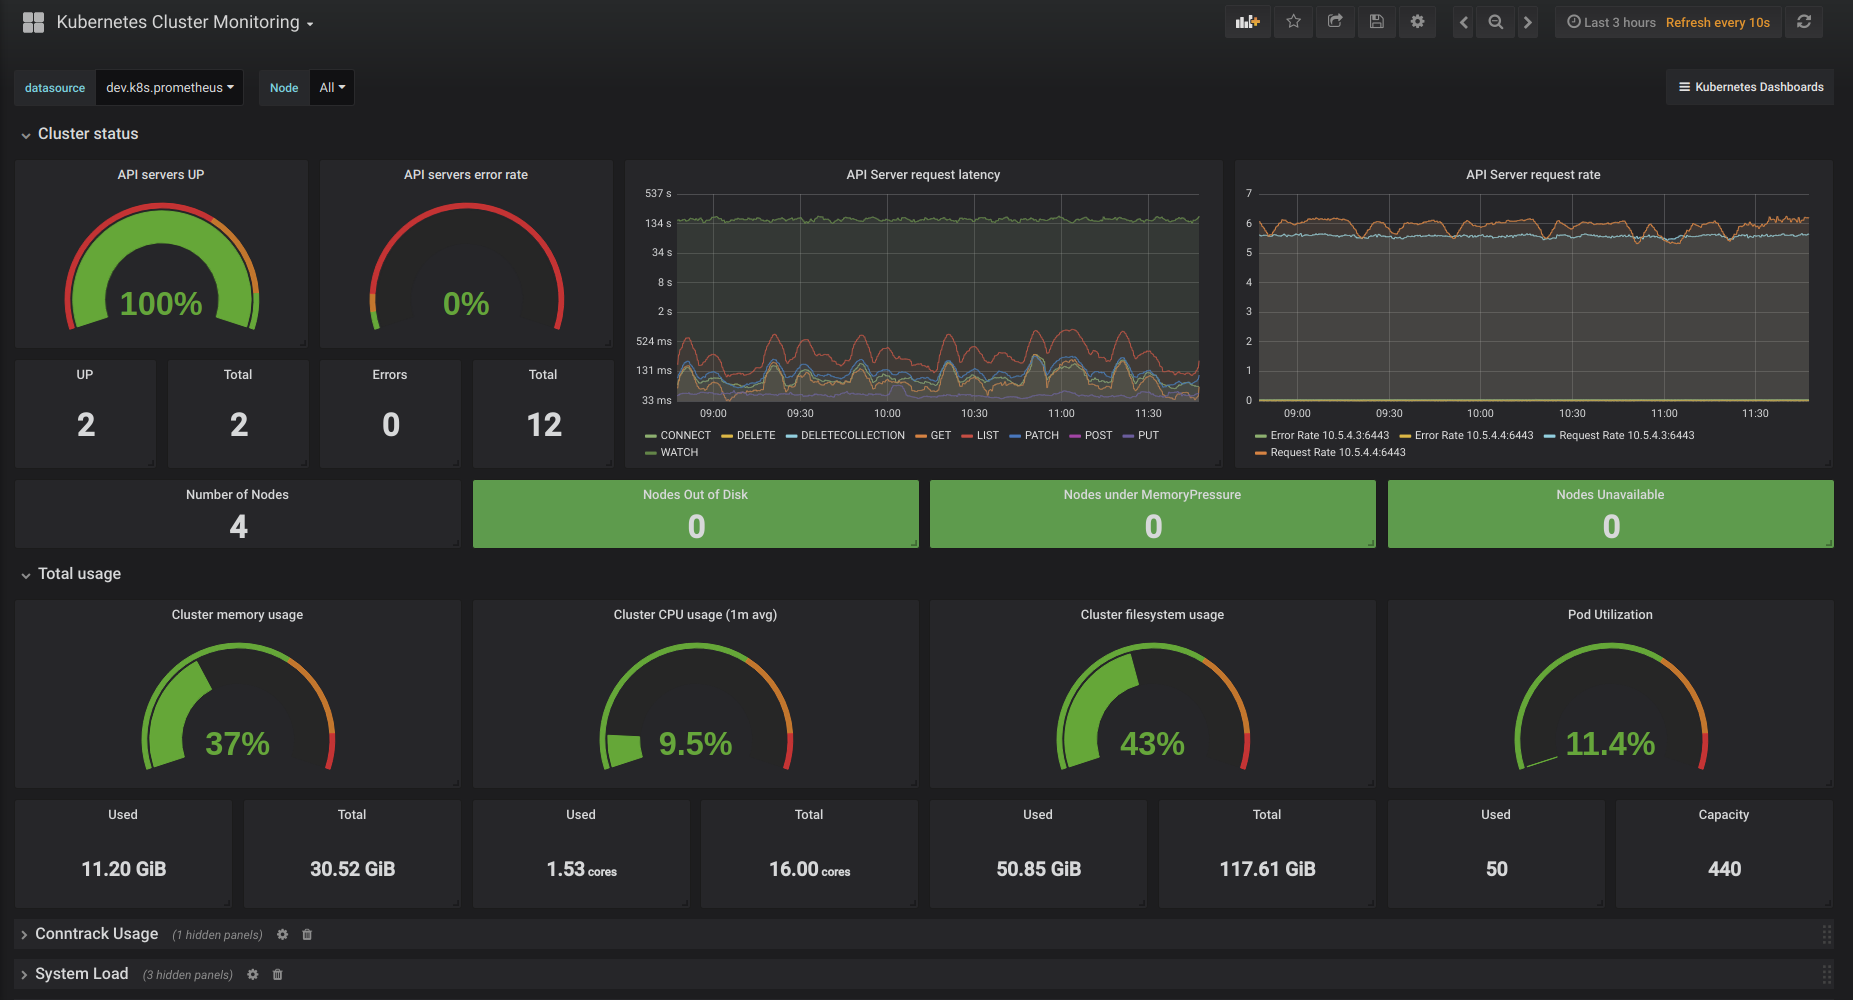
I have kept silence here for some time. But at last I have something short to say. Recently I was trying to prepare gathering of metrics from bare-metal Kubernetes clusters for observing them from my favourite Grafana. And it appeared that it's quite difficult to do that using the official documentation and blog posts. Moreover the presented Grafana dashboards were not good enough for me. So when I finished my investigations and experiments and when I was finally happy with my dashboard visualizations I pushed them to Github. The repository can be found here: https://github.com/agapoff/kubernetes-prometheus. It contains the K8s manifests for deploying Prometheus with node-exporter and kube-state-metrics apps and the appropriate ConfigMap. It also contains the json files for Grafana dashboards which can be imported and used out of the box (you need only to create the Prometheus datasource).
Feel free to feedback and contribute.
Tags: Docker, Grafana, Kubernetes, Prometheus
Category:
Kubernetes |
No comments »